Heatmaps in Risk Manager
Heatmaps provide a visual view of risks across scoring ranges and severity levels. Use heatmaps to understand how risks are distributed, identify clusters of high-severity risks, and prioritize review and mitigation activities.
In addition to predefined heatmaps (such as Inherent and Residual risks), organizations can create custom heatmaps based on their specific scoring contexts and requirements.
Use the Data visualization page in Risk Manager to define heatmap outcome and axis selections, preview the matrix, and activate the visualization for use across modules and dashboards.
Formula-based heatmaps
You can now build heatmaps using your configured scoring formulas from the scoring configuration page. This allows the heatmap to adapt to formula fields and scoring colors, providing a dynamic visualization that reflects your organization's risk scoring logic.
Create and manage custom heatmaps
You can create and manage custom heatmaps from the Data visualization menu option.
To access the Data visualization:
-
In Risk Manager, select Settings.
-
Select Data visualization.
On this page, you can create, edit, and manage heatmaps that are available across modules and dashboards.
Create a custom heatmap
-
Go to Settings > Data visualization.
-
Select Add heatmap.
-
Enter a name for the heatmap.
-
Select the Heatmap outcome.
Note
Heatmap colors and Legend names are derived from the Heatmap outcome field that is selected.
-
Select attributes for the X axis and Y axis. Choose the attributes that best reflect the risk dimensions you want to compare.
-
Review the Preview to confirm your selections before saving.
-
Activate the heatmap so it is available across dashboards and modules.
-
Save the heatmap.
After saving, the heatmap appears in the heatmap list.
After you save a custom heatmap, activate it to make it available in your Risk Manager dashboard, modules, and filtered risk views.
Heatmap status
Heatmaps can have the following statuses:
-
Draft The heatmap has been created but is not yet saved as a valid entity. The activation toggle is disabled.
-
Created The heatmap is saved and exists as a selectable entity. The activation toggle is available.
-
Activated The heatmap is active and visible across relevant modules and dashboards. You can deactivate it at any time.
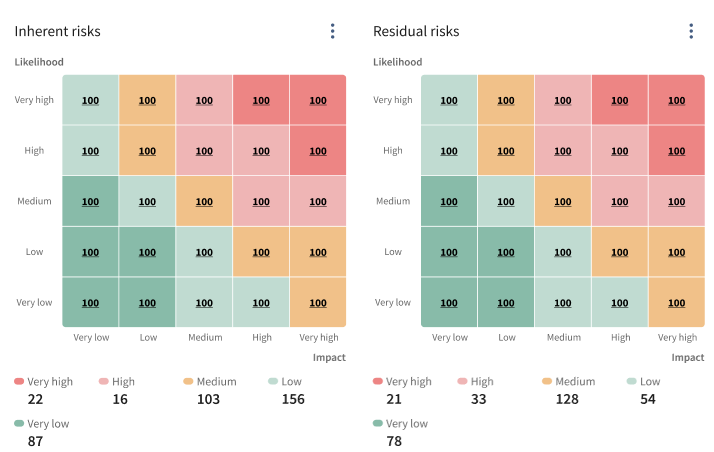
Heatmaps - Inherent Vs Residual
Heatmaps are displayed as dashboard widgets depending on your organization’s configuration.
Inherent and Residual risks heatmaps may show different scoring contexts:
-
Inherent risk is the level of risk before controls or mitigations are considered.
-
Residual risk is the level of risk that remains after controls or mitigations are applied.
Use
-
Inherent risks to understand baseline exposure.
-
Residual risks to understand remaining exposure after controls.
Understanding the heatmap matrix
Heatmaps are displayed as a matrix.
-
Each cell represents risks grouped within a severity and scoring range.
-
The placement of a risk depends on the severity values and scoring configuration used by your organization.
-
The matrix can be displayed in different sizes (for example 3×3, 4×4, or 5×5), depending on configuration.
For example, when both Likelihood and Impact fields include 5 options (Very low, Low, Medium, High, and Very high), then a 5 x 5 matrix is generated.
Severity levels and colors
Heatmap colors help indicate severity levels so users can quickly identify higher-risk areas. Severity levels may include:
-
Very high
-
High
-
Medium
-
Low
-
Very low
The available severity levels and the thresholds used can vary based on your organization’s configuration.
Risk counts in the heatmap
Each heatmap cell displays a count of risks that fall within that scoring range. This helps you understand the distribution of risks across severity levels.
To calculate the total number of risks for a category, the heatmap adds the number of risks in all cells with the corresponding color. For example, all risks in amber-colored cells are added together to show the total number of Medium risks.
Determining the risk level
Risk level is calculated based on the Likelihood and Impact values.
The following table shows the risk level for different options of likelihood and impact in a 3 x 3 matrix.
| Likelihood | Impact | Risk level |
|---|---|---|
| High | Low | Low |
| High | Medium | Medium |
| High | High | High |
| Medium | Low | Low |
| Medium | Medium | Medium |
| Medium | High | Medium |
| Low | Low | Low |
| Low | Medium | Low |
| Low | High | Low |
Viewing risks from the heatmap
Use the heatmap to open and review risks based on their placement in the matrix. To view risks in a heatmap cell:
-
On the dashboard, open a heatmap widget (for example, Inherent risks or Residual risks).
-
Select a cell in the heatmap .
-
Review the filtered list of risks associated with the selected cell.
This action supports contextual filtering from the heatmap to the risk list.
Heatmap filters
Heatmaps can include filtering controls that allow you to narrow results and focus on specific subsets of risks. For example, filters can include:
-
Object type
-
Department
-
Category
-
Severity
When you apply filters, the heatmap updates to reflect only matching risks.