
マップ グラフ
マップグラフを使用すると、さまざまな地理的場所にまたがり、データを閲覧できます。
この機能を使う状況
マップ グラフを使用すると、世界各地のそれぞれのパラメータにおいて、異なる場所がどのようなパフォーマンスを示しているのかを視覚化できます。
作業を開始する前に
マップ グラフをプロットする前に、次のデータの 1 つ以上を使用して、テーブルに列が含まれていることを確認する必要があります。
- 大陸名大陸の名前。例:北米、アジア
- 国コードISO 標準の 2 文字または 3 文字のアルファベットのコード。例:米国 を示す US または USA
テーブルの列には 2 文字または 3 文字のアルファベットのコードを含める必要があります。1 つの列に 2 文字のコードと 3 文字のコードを混在させないでください。
- 州コードISO 標準の 2 文字のアルファベットのコード。州コードの先頭には 2 文字の国コードが付加されます。例:米国のカリフォルニア州を示す US-CA
ISO コードの詳細については、ISO_3166-1 および ISO_3166-2 を参照してください。
- 緯度と経度地域の座標。例:米国を示す 7.0902 および -95.7129
メモ
- 2 文字の国コードと 3 文字の国コードが 1 つの列に混在している場合、マップ グラフは 2 文字のコードを使用してプロットされ、3 文字のコードは無視されます。
- 数個の無効な値が列に含まれている場合、マップ グラフは有効な値のみを使用してプロットされ、無効な値は無視されます。有効な値がない場合、空白のマップ グラフがプロットされます。
例
マップ グラフ
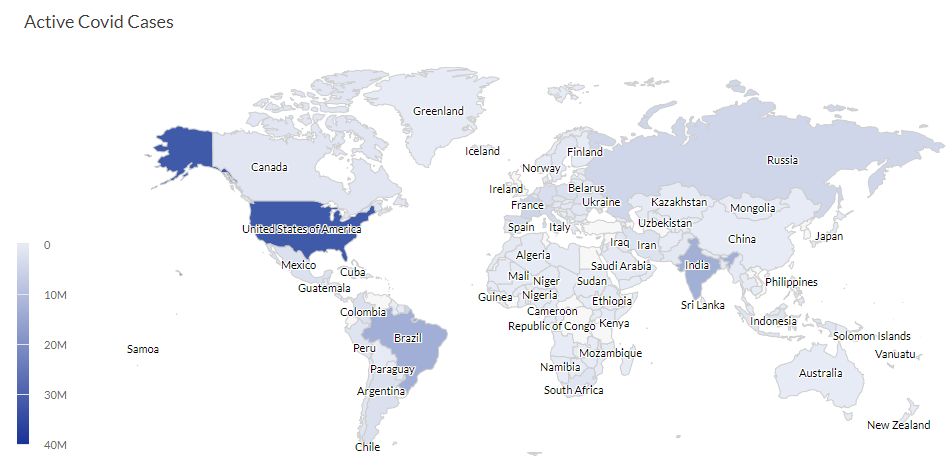
世界中で未解決の新型コロナウイルス案件を追跡しています。マップ グラフを使用して、世界の各地域における未解決の新型コロナウイルス案件を視覚化し、明確に示します。
データ構成の設定
プラットフォームホーム ページ (www.diligentoneplatform.com) から、結果 アプリを選択して開きます。
すでに Diligent One を使用している場合は、左側のナビゲーション メニューを使用して 結果 アプリに切り替えることができます。
- 該当するテーブルに移動します。
- [構成
 ]パネルで[データ]をクリックし、次の設定を構成します。
| 設定 | サポートされているデータ型 | 説明 |
|---|---|---|
Location |
| Select a value for any one of the following:
|
Value | numeric | You can select a count of the Location field or one of several aggregate values for a different numeric column in the table:
ヒント 数値データの小数と四捨五入を制御するには、その数値フィールドの書式を変更します。 平均集計オプションでは、[視覚化の構成]パネルの[データ]タブで書式オプションを使用できます。他のすべての集計オプションでは、テーブル ビューで設定された書式オプションが適用されます。これを行う方法の詳細については、「データの書式設定オプション」を参照してください。 |
グラフ表示の設定
プラットフォームホーム ページ (www.diligentoneplatform.com) から、結果 アプリを選択して開きます。
すでに Diligent One を使用している場合は、左側のナビゲーション メニューを使用して 結果 アプリに切り替えることができます。
- 該当するテーブルに移動します。
- [構成]パネルで[表示]をクリックし、次の設定を構成します。
| 設定 | 説明 |
|---|---|
| オプション | |
| Show Values | Show or hide the data point values. |
| Enable double-click zoom | Turn on or off zooming any area of the map by double-click. You can also drag the map in any direction after zooming in. |
| Show zoom button | Show or hide zoom buttons (+ and -). |
| Fixed tooltip | Show or hide tooltip in a fixed position. |
| Show gradient scale | Show or hide the gradient scale. The Show gradient scale option is currently available only for map charts with region, i.e., when you select Region under Location field in the Data tab. It is not yet supported for maps with coordinates. |
| Style | |
| Map type | Specifies the type of map you want to display:
Note When you plot a map chart using coordinates and select any of the above Map type except Continents and Countries, then you may see a few unrelated data points around the map depending on the coordinates. |
| Theme | Specifies the theme you want to display:
Default is white. |
| Gradient color | |
| Color stops | Specifies the type of gradient color stops you want to display:
Default is automatic. The Color stops option is currently available only for map charts with region, i.e., when you select Region under Location field in the Data tab. It is not yet supported for maps with coordinates. |
| Other settings | |
| Drill-down | Click on any part of the map to drill down one level. For example, click on any continent to drill down and view its countries. Similarly, click on any country to drill down and view its states. Currently, drilling down from a country to its states works only for USA and China. メモ クリックすると、1 つ下のレベルにドリルダウンします。ダブルクリック ズームを有効にしている場合は、ダブルクリックすると、地図をズームして拡大表示します。 |
