ツリーマップ グラフ
ツリーマップには、ネストされた長方形のセットとして階層状のツリー構造のデータが表示されます。各グループには長方形が割り当てられます。これは、サブグループを表す小さい長方形とともにタイル表示されます。データの個別の数値次元を示すために、サイズと色が使用されます。
この機能を使う状況
階層構造の大量のデータを処理するときには、ツリーマップを使用します。色とサイズに相関関係があるときには、表示が難しいパターンを特定するうえで、ツリーマップが役立ちます。
また、ツリーマップは、単一の画面で大量の情報を見やすく表示する際に効果的です。特定のカテゴリをドリルダウンすると、詳細を見ることができます。
メモ
ツリーマップは、現在、最大で 2 レベルのグループ化をサポートします。
例
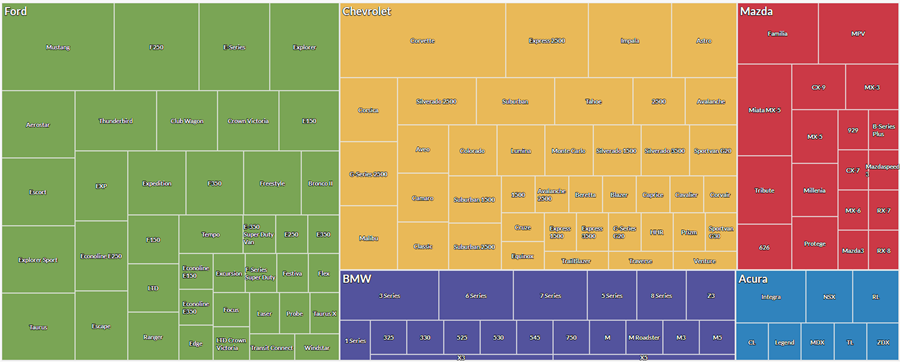
自動車メーカーとモデル
自動車の棚卸資産を含むテーブルがあります。各メーカーの車種のカウントを視覚化し、棚卸資産の概要を取得します。
このデータを視覚化するには、ツリーマップを使用します。
- メーカー、車種の順にデータをグループ化する
- サイズの基準を車両カウントに設定する
結果に基づいて、棚卸資産がメーカーと車種で分散されている方法を確認できます。
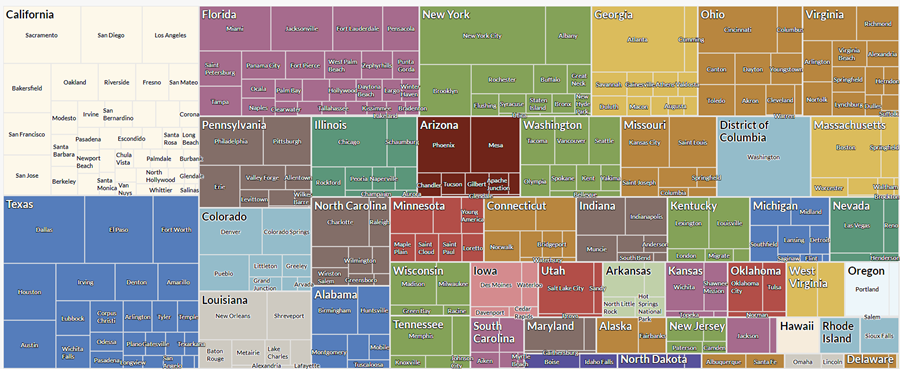
州および都市別の取引合計
米国の複数の州と都市における取引を含むテーブルがあります。分析の一部として、州別、さらに各州の都市別に、合計取引金額を視覚化します。
このデータを視覚化するには、ツリーマップを使用します。
- 州、都市の順にデータをグループ化する
- サイズの基準を取引の合計に設定する
結果に基づき、これらのグループ内の集計取引金額のパターンが出現するのを確認できます。
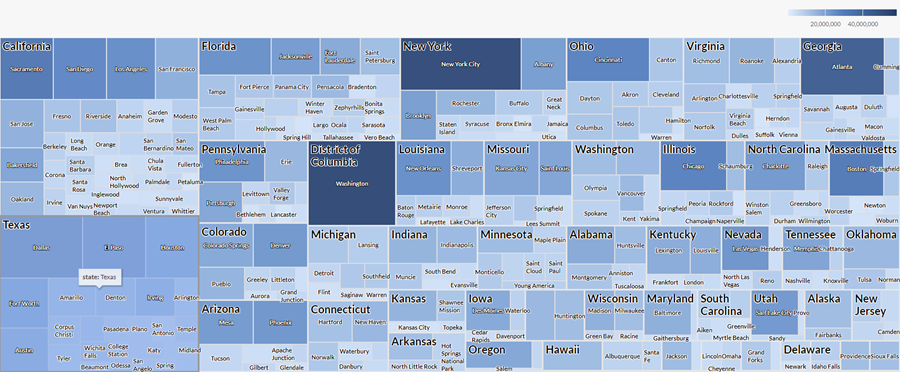
州および都市別の取引数と合計
米国の複数の州と都市における取引を含むテーブルがあります。分析の一部として、州別、さらに各州の都市別に、取引数と合計取引金額を視覚化します。
このデータを視覚化するには、ツリーマップを使用します。州、都市の順にデータをグループ化します。次の追加設定も使用します。
- サイズの基準数
- 色付けの基準取引の合計
結果に基づき、異なる都市と州の組み合わせで取引がどのように分散しているのかを判断し、これらのグループ内の集計取引金額のパターンが出現するのを確認できます。
データ構成の設定
From the Platform home page (www.diligentoneplatform.com), select the Results app to open it.
If you are already in Diligent One, you can use the left-hand navigation menu to switch to the Results app.
- Navigate to the appropriate table.
- On theConfigure
 panel, clickDataand configure the following settings:
| 設定 | サポートされているデータ型 | 説明 |
|---|---|---|
| Group |
| The fields to use as categories. The second group you select is nested within the first group. Groups are displayed as rectangles. You can select a maximum of two groups. |
| Size by | numeric | The aggregate value that determines the size of each group. You can select a count of records or one of several aggregate values for a numeric column in the table:
Tip You can control decimals and rounding on numeric data by changing format of this field. For the Average aggregate option, Format options is available in the Data tab of the Configure Visualization panel. For all other aggregate options, format options set in Table View is applied. For help doing this, see データの書式設定オプション. |
Color by optional | numeric | The aggregate value that determines the color intensity, or scale, of each group. You can select a count of records or one of several aggregate values for a numeric column in the table:
Tip You can control decimals and rounding on numeric data by changing format of this field. For the Average aggregate option, Format options is available in the Data tab of the Configure Visualization panel. For all other aggregate options, format options set in Table View is applied. For help doing this, see データの書式設定オプション. |
Format options | numeric | Select an option in this field to apply formatting such as decimals and rounding to the Y-axis values in the chart. For help doing this, see データの書式設定オプション. Format options is available only for the Average aggregate option. For all other aggregate options, format options set in Table View is applied. |
グラフ表示の設定
From the Platform home page (www.diligentoneplatform.com), select the Results app to open it.
If you are already in Diligent One, you can use the left-hand navigation menu to switch to the Results app.
- Navigate to the appropriate table.
- On theConfigurepanel, clickDisplayand configure the following settings:
| 設定 | 説明 |
|---|---|
| オプション | |
| Show Legend | Show or hide the legend at the top of the chart. |
| Boost performance | Switches into performance mode when data points on the chart go beyond 150 by applying some trade-offs. For more information, see グラフのパフォーマンスの向上. |
| Group Labels | |
| Show First Group | Include labels for values in the first group. |
| Show Second Group | Include labels for values in the second group. |
| Other settings | |
| Colors | The colors assigned to:
|